Building Kaguya's recommender from two million VNDB votes
on this page
Most of Kaguya’s visual-novel catalog came from VNDB. That gave users thousands of titles to browse, but Kaguya itself did not have enough ratings to personalize discovery. The browse page could show what was popular, but it could not use someone’s library to suggest what they should read next.
VNDB’s public dump also contained roughly two million votes from tens of thousands of users. I wanted to know whether that history could produce a personal list for a Kaguya user that was better than showing everyone the same popular titles.
Starting with Similar VNs
Before trying to recommend a list to the user, I had used the same VNDB votes to generate similar VNs.
On a visual-novel page, it showed other VNs related to the one being viewed. The result was the same for everyone, so it was not personalized. It answered "what is similar to this?" rather than "what should I read next?"
I used EASE for that feature. It learned relationships between VNs from the way people rated them. If the same readers consistently rated two titles highly, the model could connect them even when they did not share an obvious genre, developer, or series.
That experiment showed that the data used to learn those relationships did not need the same cutoff as the results we displayed. VNs with fewer votes were often too uncertain to show, but removing all of them from training made the niche parts of the results worse.
I let a VN contribute to training once it had at least 15 votes, but required 100 votes before it could appear in the results. Low-volume titles could still help the model understand a part of the catalog without being reliable enough to recommend directly.
Similar VNs showed that the voting history contained useful structure. Personalized recommendations were the harder version: instead of starting from one VN, the system now had to use everything a person had read and rated.

The first personalized dataset was too large
For the personalized recommender, I initially assumed that more interactions would give the model more to learn from. Along with VNDB votes, I included list states such as finished, playing, wishlist, stalled, and dropped.
That expanded the data to 8,903,222 interactions from 86,730 users across 37,010 VNs.
When I tried to train EASE on it, the process started thrashing swap on my 16 GB machine. The reason was the number of VNs. EASE learns a value for every possible VN pair, so 37,010 titles required a 37,010 × 37,010 model, more than 1.3 billion values. The final float32 matrix alone would have taken about 5.5 GB, before the extra memory needed during training. Our production server had 4 GB.
The list states were also weaker training signals than the votes. A vote was an explicit judgment after someone had read a VN. A wishlist entry might only mean that its cover looked interesting, its premise sounded good, or someone had recommended it. Playing and dropped were similarly ambiguous. I had increased both the size of the model and the amount of uncertainty in its training data.
I rebuilt it using explicit filtered votes, a user needed at least five votes, and a VN needed at least fifteen. That reduced the number of VNs in the model from 37,010 to 11,273.
Because EASE stores a value for every VN pair, reducing the number of titles had a large effect on the size. The final matrix fell from an estimated 5.5 GB to about 485 MiB.
| Training data | Value |
|---|---|
| VNDB votes before filtering | 2,004,393 |
| Users with at least 5 votes | 54,212 |
| VNs with at least 15 votes | 11,273 |
| Votes retained | 1,832,675 |
| Filled user–VN pairs | 0.30% |
| EASE model | about 485 MiB |
The list states were still useful, just at a different point in the system. When generating recommendations for a user, I could give finished, wishlist, and dropped their own weights. They no longer taught the shared model that wishlisting a VN meant the same thing as rating it highly.
The model could now fit in production, but that still did not tell me whether EASE was the right choice, so I compared it with six other approaches and a popularity baseline.
Comparing seven models
I did not want to keep EASE just because it had worked for the Similar VNs feature. I implemented six alternatives: SVD, ALS, LightFM, Surprise SVD, LDA, PMI, and compared all seven against a popularity baseline.
To compare them, I used ratings we already had and pretended that a small part of each user’s history had not happened yet.
Suppose a VNDB user had rated 20 VNs at 7/10 or higher. I hid two of those ratings and left the rest of their history in the training data. The two VNs still appeared elsewhere in the dataset through other users’ ratings; the model just no longer knew that this particular user had liked them.
I repeated that split across all eligible users, using the same hidden ratings for every model, then trained each model once on the remaining data.
After training, I asked each model for 20 recommendations for that user. It could use the 18 positive ratings I had left visible, but not the two I had hidden. If either hidden VN appeared in the recommendations, the model had recovered something we already knew the user liked.
I measured:
- Recall@20: if I hid two VNs and one came back in the top 20, recall for that user was 50%.
- NDCG@20: similar to recall, but a hidden VN returning near the top counted more than one returning at rank 20.
- Hit@20: whether at least one hidden VN appeared in the top 20.
This test did not tell me whether someone would enjoy a VN they had never heard of. It tested a narrower question: given part of a person’s known taste, could the model recover other titles we already knew they liked?
I ran the same test with a simple popularity baseline. It ignored the user’s visible ratings and returned the most-voted VNs in the catalog, excluding the titles still present in their history.
Suppose Steins;Gate was one of the two ratings I hid. Once that rating was removed, the baseline no longer knew that the user had already seen it, so it was eligible to be recommended. Since Steins;Gate was already near the top of the global popularity list, the baseline was likely to return it, not because it had learned anything about that user, but because it recommended the same popular title to almost everyone.
This happened often. Popular VNs appeared in many users’ libraries, so they also appeared frequently among the ratings I hid. The generic popularity list recovered about 28% of the hidden positives without using the individual user’s taste at all.
That made it the minimum bar for the personalized models. If a model could not recover more of the hidden ratings than a list created by sorting the catalog by popularity, it was adding complexity without improving what Kaguya could already show.
A later rerun of the same evaluation, using the final standalone scorer, covered 50,079 users::
| Method | Recall@20 | NDCG@20 | Hit@20 | Train time |
|---|---|---|---|---|
| Popularity | 0.2820 | 0.1361 | 0.3853 | — |
| EASE | 0.3490 | 0.2556 | 0.4903 | 17.1 s |
| SVD | 0.3363 | 0.2179 | 0.4721 | 2.6 s |
| ALS | 0.3144 | 0.2054 | 0.4511 | 8.2 s |
| LightFM | 0.2382 | 0.1590 | 0.3579 | 222.4 s |
| Surprise SVD | 0.2054 | 0.1424 | 0.3208 | 9.3 s |
| LDA | 0.2005 | 0.1107 | 0.2927 | 43.5 s |
| PMI | 0.0783 | 0.0412 | 0.1308 | 1.3 s |
A Recall@20 of 0.349 meant that EASE returned about 35% of the hidden positive ratings in the first 20 results. That was 24% higher than popularity. Its NDCG@20 was 88% higher, meaning the titles it recovered also tended to appear closer to the top.
I did not want to choose from the table alone. I built an internal Next.js page that showed all seven recommendation lists for the user profile.
For each profile, I looked for problems the holdout test could not show clearly:
- titles the user had already rated or rejected;
- too many results from one franchise;
- the same popular VNs appearing for everyone;
- niche recommendations with no clear connection to the user’s library;
- which existing ratings were actually driving each result.
The models behaved differently.
SVD came closest to EASE in the benchmark, but its lists leaned much more popular. In a sample of 200 users, the median EASE recommendation had around 1,365 VNDB votes; for SVD it was around 6,171. ALS sat between them and often found sequels and related entries well.
LightFM was the hybrid model. I expected its writer, producer, and series data to help when ratings were sparse, but it still finished below the popularity baseline. Surprise SVD also stayed below it.
LDA and PMI went much further into the catalog. Some of their lists were interesting, but they were better at producing unusual discovery picks than answering the main question: what is this person most likely to enjoy next?
EASE was the strongest overall. It led the benchmark and produced the most convincing lists when we compared real profiles side by side. Those manual checks were also useful later: they caught problems with franchise clustering, weak explanation sources, and individual recommendations that looked reasonable in the aggregate metrics but wrong for the person.
I chose EASE for the personalized recommender. In the first version, however, we still had another ranking stage and far more complexity than we eventually needed.
The first pipeline had two stages
Once EASE was trained, it contained one learned value for every pair of VNs. That value answered a question like: how much should a user’s opinion of one VN affect the score of another?
Those relationships came from VNDB’s rating patterns. If people who rated several VNs in a user’s library highly also tended to rate another VN highly, that candidate would receive support from each of them.
For one user, the scoring step looked roughly like this:
candidate score =
contribution from each VN in the user’s library,
added together
A title in the user’s library could push a candidate up or down. After adding those contributions, I removed VNs the user had already interacted with and sorted everything else by score. This produced EASE’s initial ranking.
The first version did not use that ranking directly. It kept the top 500 candidates and passed them through a second ranking stage.
Each candidate started with its EASE score. The reranker then adjusted it:
- sharing a writer, producer, or series with VNs the user liked added a boost;
- newer titles received a small boost;
- extremely popular titles received a small penalty.
It then selected the final 100 one at a time. After choosing a VN, it lowered the scores of remaining candidates that were too similar to it. A sequel could be promoted because the user liked the original, for example, without letting several titles from the same franchise fill the top of the list.
user’s library
  -> EASE scores every unseen VN
  -> keep the top 500
  -> adjust scores using metadata, freshness, and popularity
  -> select and store 100 while pushing down near-duplicate results
This worked, but selecting the final 100 results was much slower than the initial EASE scoring.
I made the reranker faster, then removed it
Before spending more time optimizing the slow second stage, I checked its extra signals one by one.
The writer and producer boost was the first to go. Turning it off lowered offline NDCG, especially for less popular VNs, but manual checks showed that it was often promoting titles simply because they shared a prolific creator. Those titles did not always fit the rest of the user’s library, so I removed the boost.
The second stage was still slow. Early timings projected roughly 18 minutes to generate recommendations for 918 users.
The scorer ran in Elixir with Nx and EXLA. EASE’s numerical work ran inside XLA, while the reranker ran in regular Elixir. Since every selection changed the scores of the candidates left behind, it had to choose the final 100 one at a time and pull data back into Elixir on every pick.
For each recommendation, the scorer also found the three titles from the user’s library that had contributed most to its score. Those were shown on the page as the reasons behind the recommendation, and calculating them repeated the same transfer. Together, the two steps crossed the XLA–Elixir boundary roughly 200 times per user.
I converted the top 500 candidates to plain Elixir data once, then completed both steps there. The next full run generated 88,541 rows for 918 users in 103 seconds. I checked the output across several accounts and found no ranking changes from the optimization; the saved parity check had an identical top 100 before and after.
After dropping the writer and producer boost, I compared the second stage with EASE alone. In the comparisons I saved, 19 of the top 20 recommendations were the same in one list and 17 were the same in another. Most of the changes were sequels and same-franchise titles moving a few places. In one list, a sequel moved from 14th to 7th while nearly everything else stayed the same.
The second stage was mostly rearranging the same list, so I removed it, along with the feature data and extra ranking code, and Kaguya used EASE’s order directly.
Choosing the model was only one part of the ranking. The output also depended on what we treated as evidence of a user’s taste.
What counted as a preference
EASE learned the relationships between VNs from VNDB votes. When generating recommendations for a Kaguya user, though, I had more than ratings to work with. Their library also recorded whether a VN was read, currently reading, wishlisted, on hold, or unfinished. On the recommendation page, they could also choose to either wishlist a VN or mark it as not for them, using the + Wishlist or Not for me buttons.
The same VN could have more than one of those signals. Someone might mark a title as read and later give it a rating, for example. Counting both would give that VN more influence than intended, so I used one value per title:
-
Use the explicit rating when one exists.
-
Otherwise, use feedback from the recommendation page.
-
Otherwise, use the reading status.
For titles without a rating, the final weights were:
| Signal | Value used for scoring |
|---|---|
+ Wishlist on a recommendation | 8.0 |
| Read | 7.5 |
| Currently reading | 7.0 |
| Wishlist | 6.0 |
| On hold | 5.0 |
| Did not finish | 3.0 |
Not for me on a recommendation | 2.5 |
Finishing a VN was stronger evidence than saving it for later, while Not for me counted as a negative signal.
I also adjusted the values around each user’s own average. Suppose one person averaged 8 and rated a VN 9, while another averaged 6 and rated it 7. Both became +1: one point above that person’s normal rating. Values below their average became negative.
This stopped someone who used only the top half of the rating scale from looking more positive about everything than someone who used the full scale.
For each recommendation, I stored the three strongest positive contributors and showed them as the “because you liked…” reasons.

Those reasons exposed a problem with wishlist weighting. In one account, 23% of them came from titles the user had only wishlisted, not read or rated. I lowered wishlist from the same weight as a completed VN to 6. It could still influence the results, but it was no longer treated like evidence that the user had enjoyed the title.
To inspect the scores more closely, I added a debug popover on hover that showed the full contribution breakdown: every title involved and how much it had pushed the recommendation up or down. When a result looked wrong, I could trace it back to the exact signals behind it instead of guessing.
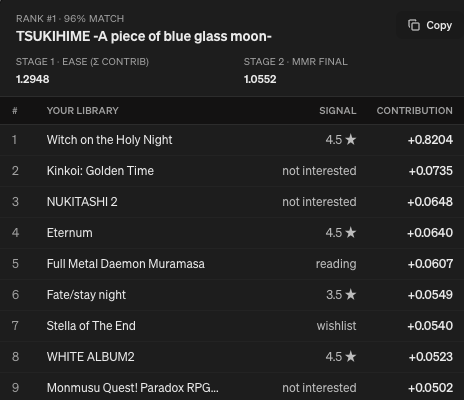
That deeper view exposed a stranger problem: in some cases, a VN the user disliked could push another title higher.
When a low rating pushed another title up
The debug view showed the individual contributions that made up each recommendation score. Each contribution was calculated as:
centered user value × EASE coefficient
The coefficient could be positive or negative. Multiplying it by the user’s centered value determined whether that VN pushed the candidate up or down.
Suppose a user’s average value was 7 and VN A had a value of 4. After subtracting their average, VN A became -3.
Now suppose EASE had learned a coefficient of -0.10 from VN A to candidate B:
-3 × -0.10 = +0.30
VN A was below the user’s average, but it still added +0.30 to candidate B’s score.
Across the full calculation, there were four cases:
above average × positive coefficient -> boost
above average × negative coefficient -> penalty
below average × positive coefficient -> penalty
below average × negative coefficient -> boost
The first three matched the behavior I wanted. The last one was causing the strange results I saw in the contribution breakdowns.
A negative coefficient did not mean that candidate B was literally the opposite kind of VN. It only meant that EASE had learned a negative relationship between the two from the rating data.
The user’s negative value could also come from different reasons. They may have disliked the VN, dropped it because of its length, or simply not been in the mood for it.
Together, those two negatives could give a candidate a surprisingly large boost.
I changed the scorer to ignore only that case:
centered user value < 0
and EASE coefficient < 0
-> contribution = 0
The other three cases stayed. A candidate similar to something the user rated poorly could still move down, and a candidate with a negative relationship to something they liked could still be penalized. The production scorer preserves this exact rule.
not_interested remained a hard mask: the title itself could never be recommended again, but it no longer affected the scores of unrelated candidates. Explicit low ratings and did_not_finish remained as negative signals.
Once the score made sense, I had to decide when to calculate it.
Generating recommendations ahead of time
There was no reason to rebuild the same recommendation list every time someone opened the page. Its inputs mostly changed when the user rated a VN, updated their library, or reacted to a recommendation.
I generated the lists in the background and stored them in Postgres. A scheduled job rebuilt them twice a week. Users could also refresh their own list, and importing a VNDB library generated fresh recommendations for that account.
Opening the page then loaded the saved recommendations. The model only ran when a list needed to be rebuilt, not on every visit.
That worked for signed-in Kaguya users because their library and feedback were already in our database. We also wanted someone to enter a VNDB username or user ID and get recommendations without signing up. In that case, Kaguya might be seeing the profile for the first time.
Recommendations without signing up
The first version generated recommendations when someone submitted a VNDB username or user ID.
Kaguya fetched that person’s library from VNDB, converted their votes and list states into preferences, ran EASE, and cached the result.
VNDB returned at most 100 list entries at a time, so larger libraries took several requests to fetch. A profile Kaguya had not seen before therefore had to wait for both the VNDB calls and the recommendation scoring. On a cold request, that could take several seconds.
I already had much of the same user data locally in the VNDB dump used to train the model. I exported the 54,212 filtered user histories into an 18 MB binary and loaded it into ETS, Elixir’s in-memory storage.
This became the Cached mode. Instead of fetching a profile from VNDB, Kaguya could look up that user’s preferences locally.
The distinction was:
Live
-> fetch the latest library from VNDB
-> run EASE
Cached
-> read the library from the imported dump
-> run EASE
Cached avoided the network call, but it still loaded the roughly 485 MiB model and scored the user during the request. It also covered only the profiles present in that particular snapshot. Newer users, or users who had not passed its filtering threshold, still needed the live path.
Both versions were still doing work that did not need to happen while someone waited for the page. Live mode fetched the inputs and then scored them. Cached mode already had the inputs, but still scored them.
I moved the scoring itself offline.
The final batch went through the VNDB profiles in the imported dump, generated their recommendations ahead of time, and wrote two files: one mapping usernames to VNDB user IDs and another containing the recommendation results.
When the application started, Elixir loaded both into ETS. A request now looked like this:
VNDB username or user ID
-> find the user in ETS
-> read their precomputed recommendations
-> load the matching titles and covers from Postgres
The snapshot stored recommendation IDs and scores; Postgres supplied the catalog data needed to render the page. The request no longer fetched the user’s library from VNDB or ran EASE.
| Final snapshot | Value |
|---|---|
| Profiles attempted | 54,515 |
| Profiles with recommendations | 54,450 |
| Recommendations stored | 1,536,276 |
| Recommendation snapshot | about 73 MiB |
The final path was an in-memory lookup followed by one catalog query. There was no request-time VNDB call, Python process, or Nx scoring.

Signed-in Kaguya users still used the Postgres path from the previous section because their ratings and feedback could change at any time. The no-sign-up flow represented a much larger VNDB snapshot, so generating it in one offline batch was a better fit.
What an 89% match meant
Pregenerating the VNDB recommendations also gave me a way to improve the match percentage shown on each recommendation card.
EASE produced a raw score used to order a user’s recommendations. A value such as 0.42 was useful to the scorer, but it had no obvious meaning to the person viewing the page. It was not 42%, 4.2 out of 10, or a 42% chance that they would like the VN.
At first, I scaled each profile against its own strongest result. The top recommendation always showed 96%. A recommendation with half that score showed 68%, and weaker results approached 40%.
That made one person’s list easier to scan, but every profile had its own scale. If one user’s best score was 1.2 and another’s was 0.3, both still showed 96%. A 90% match only meant that the recommendation was close to the strongest result on that particular profile.
The offline batch had now produced more than 1.5 million recommendations for over 54,000 VNDB profiles. Instead of comparing a score only with that user’s best result, I could compare it with all of the recommendation scores generated in the batch.
For example, suppose a recommendation scored higher than 890 out of 1,000 stored scores. Its card would show an 89% match.
The percentage now had the same definition across profiles. An 89% match meant that the score was higher than roughly 89% of the recommendation scores generated across the VNDB snapshot. It still did not mean there was an 89% chance that the person would like the title. It was a percentile of the model’s score, not a probability.
While checking that population-wide batch, I found a different problem: many of the users with the largest libraries had no positive recommendations at all.
The users with the most ratings got no recommendations
Each unseen VN received a score by adding together its contributions from the user’s library. Some titles pushed the score up, while others pushed it down.
For example:
+0.40 from one VN
-0.55 from another
+0.05 from a third
= -0.10
A score below zero meant that, overall, more of the user’s library had pushed that candidate down than up.
At first, I still took the 50 highest-scoring candidates. That could include a VN with a score of -0.10 simply because the others scored -0.30, -0.50, or lower. It was the highest of the negative scores, but the model still had no positive reason to recommend it.
I changed the scorer to keep only candidates with a score above zero. When I reviewed the full VNDB batch after that change, 510 profiles had no recommendations. The problem was concentrated among the largest libraries: 44 of the 51 users with at least 1,000 votes were in that group.
A user with 1,000 ratings did not give the model 1,000 positive examples. After mean-centering, many of those ratings were below that person’s average and could lower a candidate’s score. The double-negative fix from earlier also stopped some negative values from turning back into boosts. For these large libraries, every unseen VN could end up with a score of zero or below.
For profiles with fewer than three results, I added a simpler fallback. It used the user’s 100 highest ratings without mean-centering. I still excluded their complete library, so a VN they had already rated could not return just because it fell outside those 100 titles.
Skipping mean-centering produced larger raw scores, so I scaled the fallback scores into the same range as the normal ones before calculating the match percentage. Otherwise, those recommendations would have appeared artificially stronger.
After the change, all 51 users with at least 1,000 votes also received recommendations.
That was the last scoring change in this version of the recommender.
Where the recommender ended up
Kaguya ultimately served only EASE. The other six trainers stayed in the public project so the comparison could be reproduced, but their product paths and the second ranking stage were gone.
For signed-in users, Elixir and Nx regenerated recommendations in the background and stored them in Postgres. For someone entering a VNDB username without signing up, I generated the full snapshot offline and loaded it into ETS. Opening either page only loaded results that had already been scored.
Kaguya had started with the same popular titles for everyone. The version I kept produced a personal list, showed which titles in the user’s library had influenced each result, and did the expensive work before the page was opened.

The open-source python repo for building the data, training the models, running the evaluation, and standalone inference is available at Kaguya’s visual-novel recommender.