Tracing Kaguya’s Navigation Stalls to Recurring OOM Restarts
on this page
Kaguya started as a social book-discovery and tracking product before we pivoted to visual novels. During the books era, we occasionally saw an issue where an internal navigation would sit on the loader for 10–20 seconds before the page finally changed. It was sporadic and difficult to reproduce, so it kept getting pushed behind more immediate work.
We pivoted to visual novels in January 2026, then spent about three months stabilizing it, bringing over the shared features from the books product, and building features specific to visual novels. As we were preparing a Reddit post about the update, Vasanth, Kaguya’s founder, hit the same stall again. We were about to put the product in front of more users, so I started tracing what happened after the click.
Matching the stall to a frontend restart
At the time, the frontend was running on a shared Fly.io instance. We had already planned to move the product after the pivot to Hetzner because of separate reliability problems with Fly. The migration was not initially related to the navigation issue.
I added Sentry tracing around the navigation path and left it running for a few days. When another incident was recorded, I checked the frontend and backend logs at the same timestamp. The Phoenix and GraphQL backend had no corresponding failure, but the Next.js frontend had recorded:
FATAL ERROR: Reached heap limit
Allocation failed - JavaScript heap out of memory

...

Main child exited with signal 'SIGABRT'

...

could not complete HTTP request to instance:
connection reset by peer
The timestamps lined up with the navigation stall. That gave me a working explanation: while the browser was waiting for the next page, the frontend process had exhausted its heap and aborted.
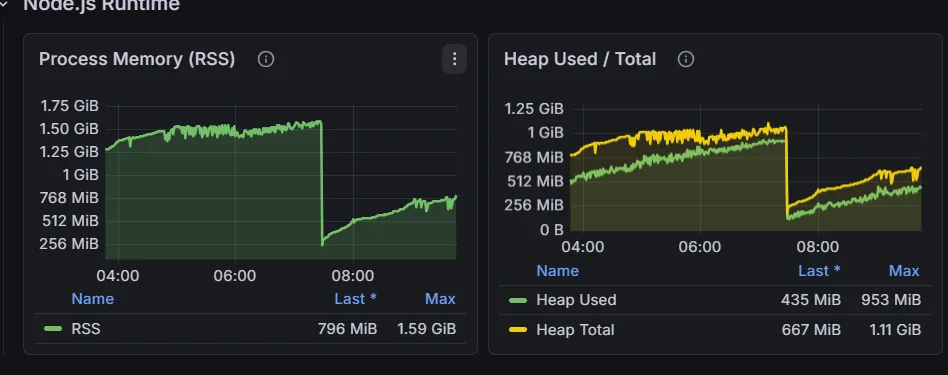
I still had only one matched incident, so I added Node.js process metrics for heap used, total heap size, RSS, and uptime, exposed them for Prometheus, and charted them in Grafana. Over the next several days, the graph showed the same pattern repeating: memory climbed for several hours, dropped when the process restarted, and then began climbing again.

The same pattern on Hetzner
We then moved to Hetzner as already planned. The migration was mainly to get away from the unrelated reliability problems we had experienced on Fly.io, but it also gave me a useful comparison: the frontend was now running on a different provider with considerably more memory.
I kept the process metrics in place and sent them into Grafana Cloud through Alloy. The same pattern continued on the Hetzner server. Heap usage and RSS climbed until the process restarted, then began rising again from the new baseline.
I temporarily increased V8’s --max-old-space-size budget in stages: first to 768 MB, briefly to 900 MB, then to 1 GB, and finally to 2 GB. Each increase kept the process alive for longer, but memory continued moving toward the new limit.
The additional memory was useful because it gave me a larger window to inspect the process, but it did not stop the underlying growth.
At that point, the frontend was running in Docker on a 4 GB Hetzner server with Next.js 14.2.35, Node.js 20.11.0, and @sentry/nextjs 8.55.0. I added a protected production endpoint around v8.writeHeapSnapshot() so I could capture the heap before the process died.
Comparing two heaps
I took one snapshot early in the process lifetime and another after several hours of production traffic. Both came from the same deployment. DevTools showed 95.65 MB of retained heap in the first snapshot and 778.03 MB in the second. The timestamps retained in the snapshots placed them about 5 hours and 13 minutes apart.
Compared with the first snapshot, the second contained 1.28 million strings, 918,000 arrays, 172,000 maps, and nearly half a million closure contexts. More importantly, it showed 14,023 additional IncomingMessage objects.
IncomingMessage is Node’s representation of an incoming HTTP request. Once a request has completed, it should eventually be collected. Here, thousands of old requests were still reachable.
The IncomingMessage row itself accounted for 14.7 MB. That was not the entire increase. The headers, strings, arrays, responses, sockets, streams, and other objects reachable from those requests were listed separately and made up much of the remaining growth.
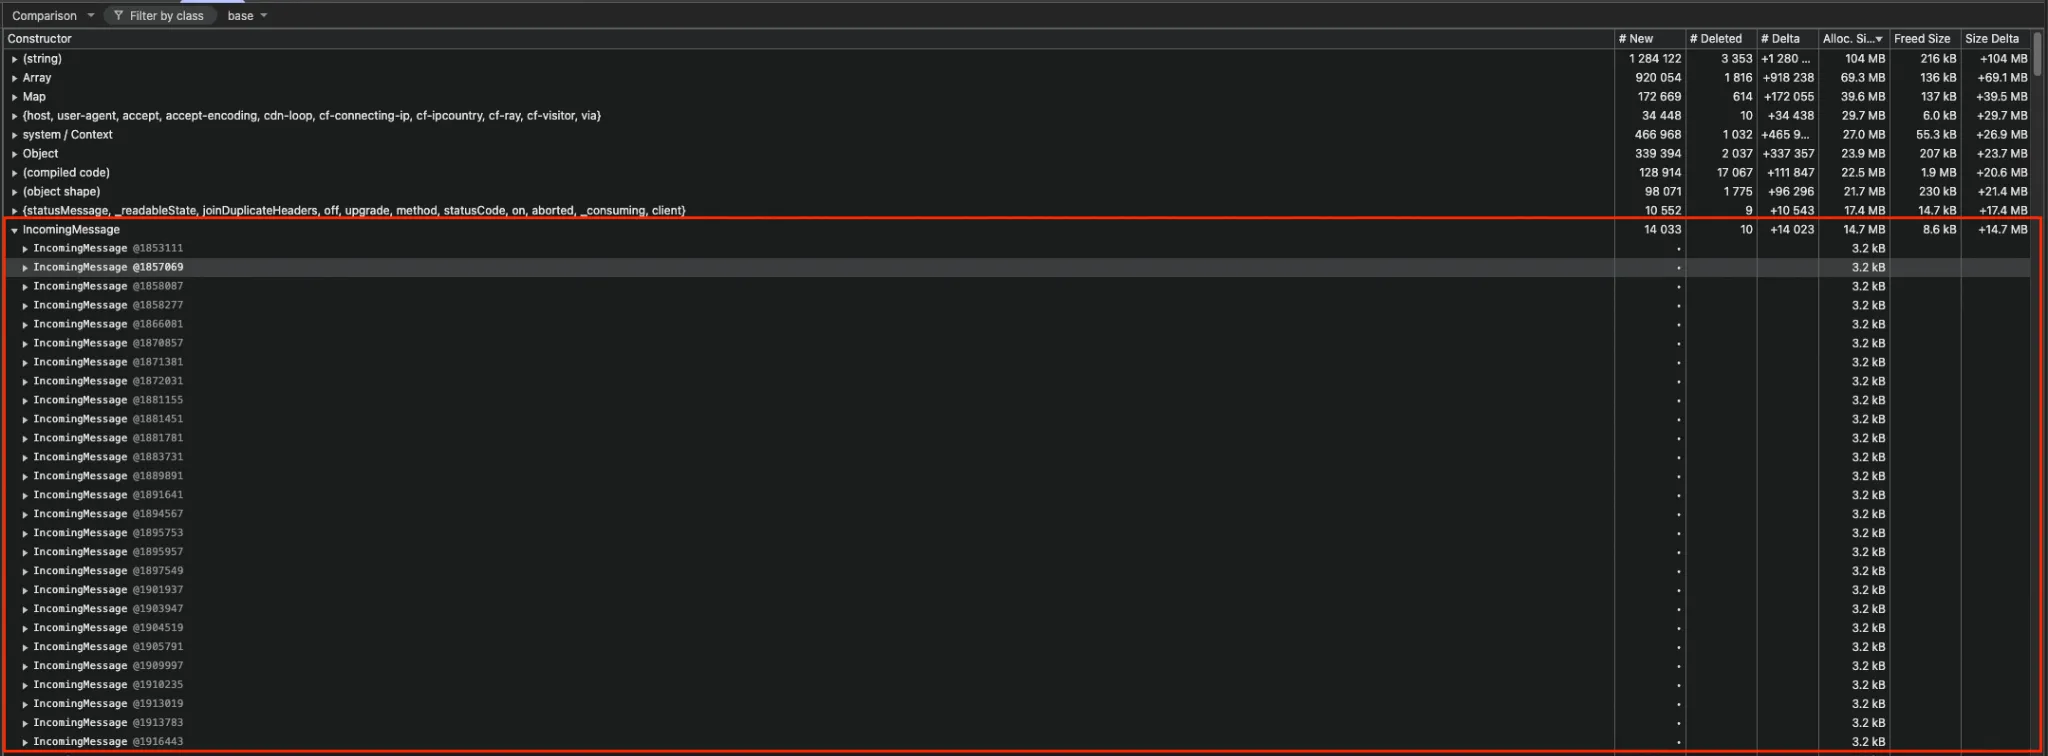
I then expanded the strings. Many of the largest retained strings contained _sentryDebugIds. There were also serialized Sentry events containing the SDK name, version, event timestamp, and Sentry ingest address.
This was a useful clue, but not yet proof. We intentionally sent browser Sentry events through the Next.js server using /_sen_tunnel, so Sentry-related strings were expected to appear in memory. I still needed to find what was keeping them there.
I selected the /_sen_tunnel URL inside one of the retained requests and opened its Retainers path. The request appeared inside Sentry’s _sdkProcessingMetadata, which was attached to a Sentry isolationScope. This was the first direct evidence that Sentry was keeping the original Node request reachable after it had finished.
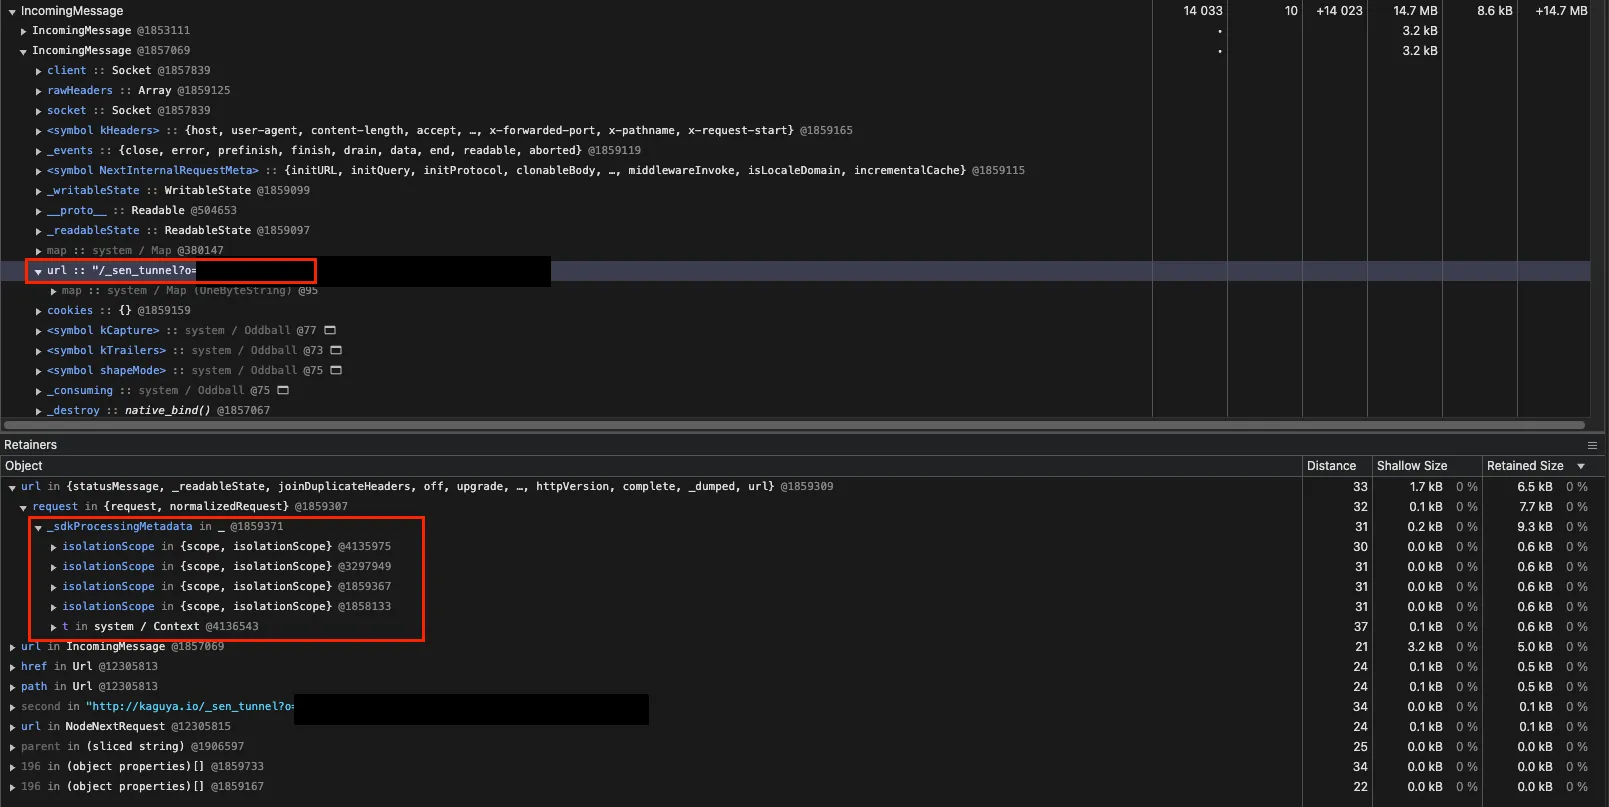
The Sentry-specific fields gave me something concrete to search for. I found a related issue in Sentry’s Express integration where the SDK retained the complete Node request instead of only the smaller normalized request data. Although it was reported for Express rather than Next.js, the retention pattern matched what I was seeing in the heap, and the fix was available in a newer SDK version.
The Sentry upgrade reduced the growth
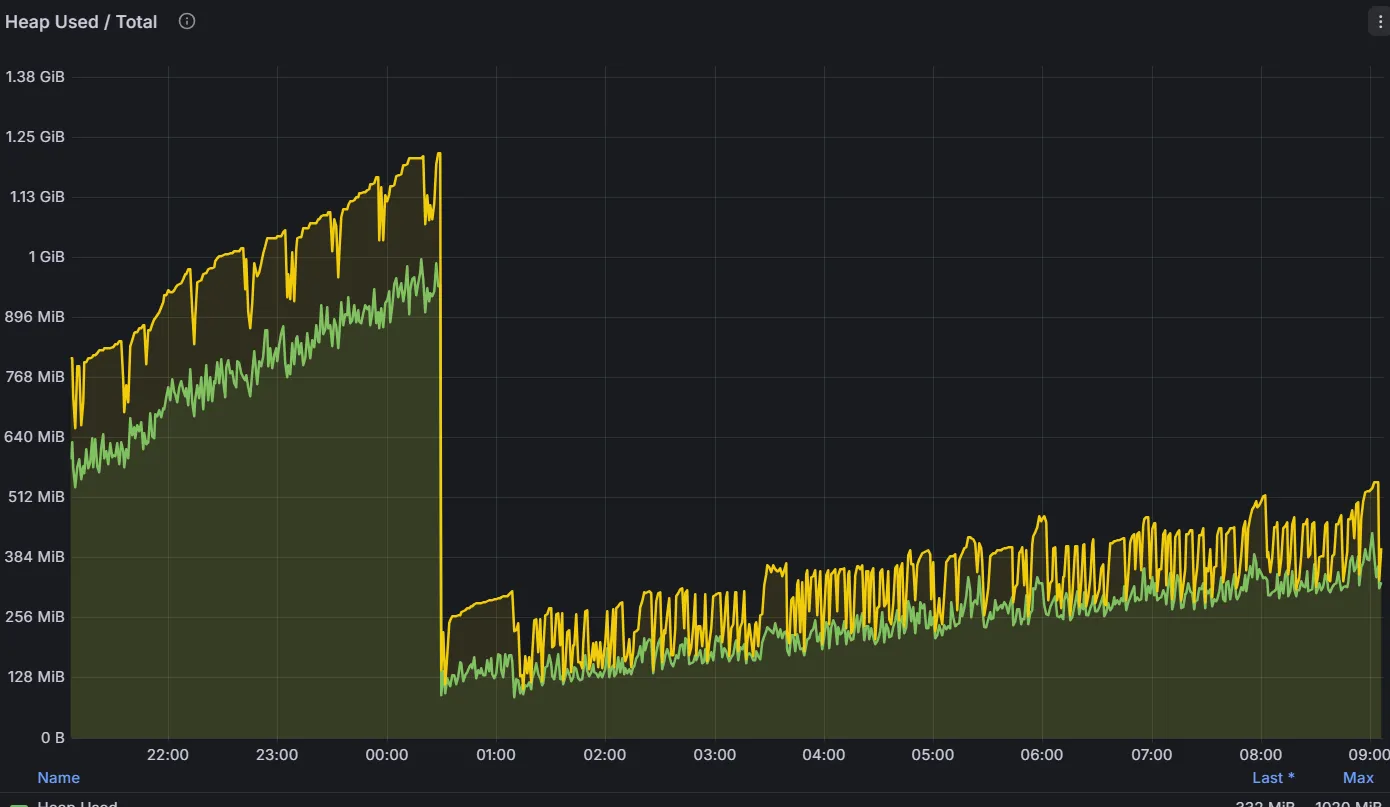
I upgraded @sentry/nextjs from 8.55.0 to 9.47.1 and continued monitoring the same metrics. Over the next several hours, the heap still climbed, but much more slowly. In the saved window, its growth rate was roughly one-quarter of what it had been before, while the baseline was still rising.
Root cause
The slower growth showed that the Sentry upgrade had helped, but the process would still eventually reach its limit. I went back through the other possible causes.
Next.js had previously leaked request data through its patched global fetch(). I briefly tried using an imported Undici fetch in Apollo, but the fix had already shipped in Next.js 14.2.3. We were running 14.2.35, so I reverted the change.
I also found an Undici memory regression reported with newer Node 20 releases. We were running Node 20.11, which predated the affected versions.
The snapshots contained thousands of Next.js IncrementalCache objects, but together they accounted for only around 2.1 MB of the increase. That was real growth, but nowhere near enough to explain a heap that had grown by 682 MB.
The remaining clue was at the end of another retainer path in the original snapshot. Beyond Sentry’s isolationScope, the path continued through Node’s async-context internals to a Timeout, which was still reachable from knownTimersById:
isolationScope
  → kResourceStore in Timeout
  → knownTimersById
This led me to a Node bug. In affected versions, converting a timer to a number could leave it in knownTimersById even after it had finished. We were running Node 20.11.0, while the fix shipped in Node 20.16.0.
This also explained the partial improvement after the Sentry upgrade. Sentry 8.55 stored the complete request inside the context. The newer version stopped doing that, so each retained context became smaller. But if the timer was still keeping the context alive, memory would continue to grow.
Updating the frontend stack
We had already planned to update the frontend stack after the visual novel pivot. Since Node also needed to be updated for the timer fix, we upgraded Node 20.11.0 to 24.14.0, Next.js 14.2.35 to 16.1.7, and React 18 to 19 together.
I continued watching the same Grafana metrics. Before this deployment, every garbage-collection cycle left the heap at a higher level. Afterwards, it repeatedly returned to roughly the same range.
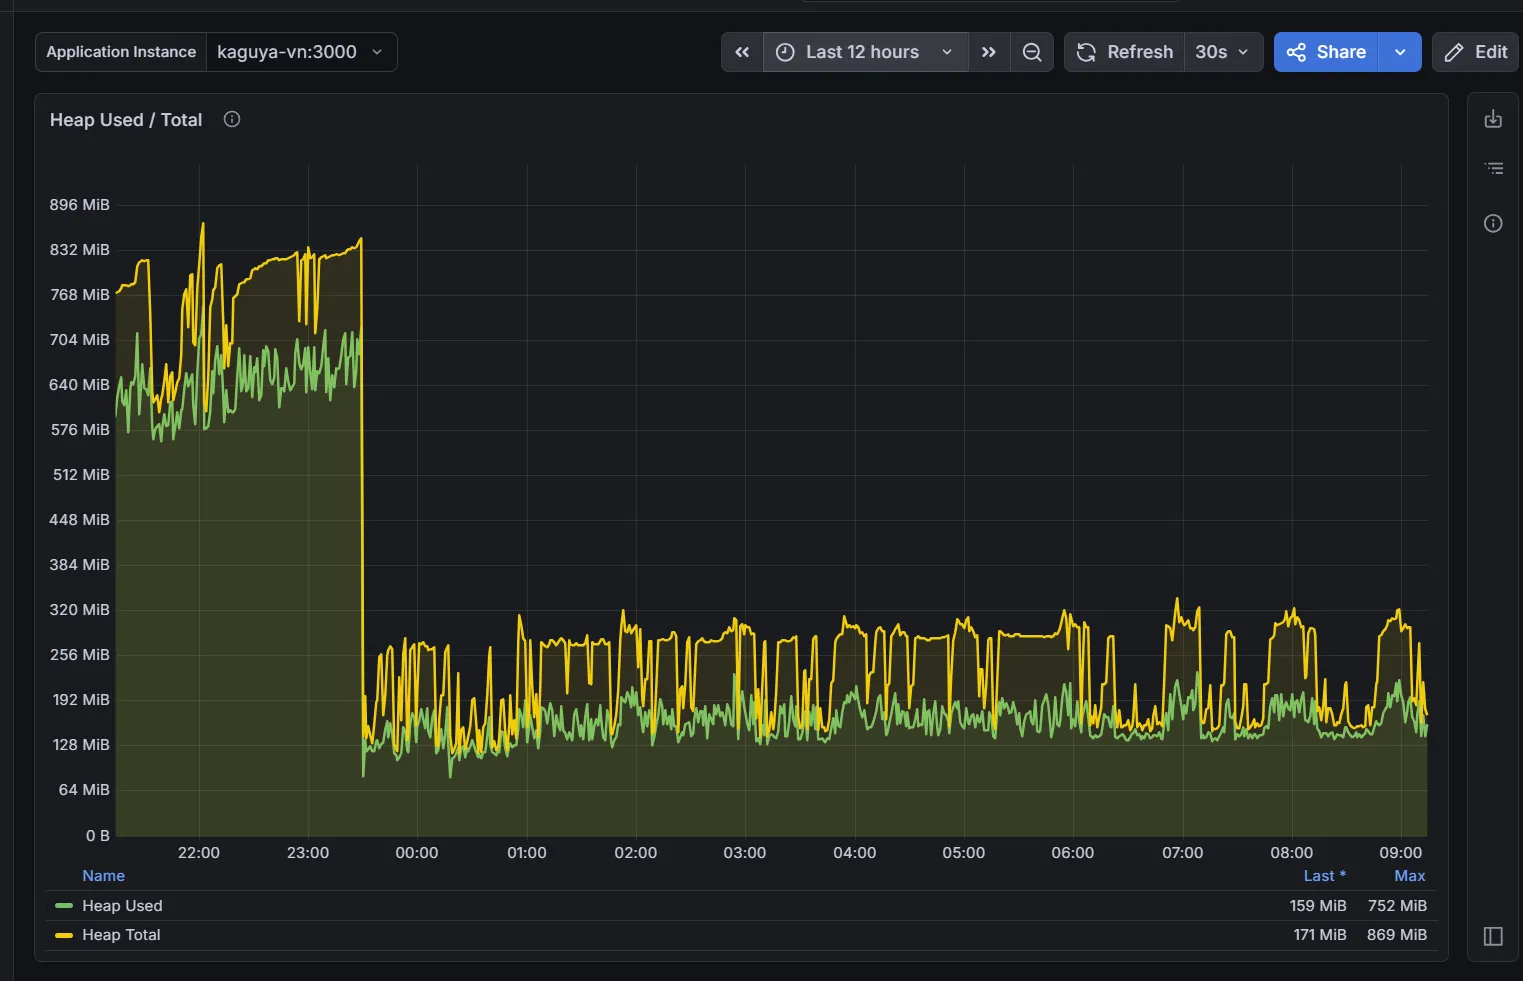
Because Node, Next.js, and React were upgraded together, I cannot say that Node alone fixed the remaining leak. What I did verify was that the memory baseline stopped rising, and the OOM restarts and navigation stalls did not return during the rest of my time at Kaguya.